Break open a cherry tree and there are no flowers, but the spring breeze brings forth myriad blossoms. – Ikkyu
This long-awaited post is all about animation.
animation
blossoms
geom_plot
Japan
ggimage
Published
April 7, 2023
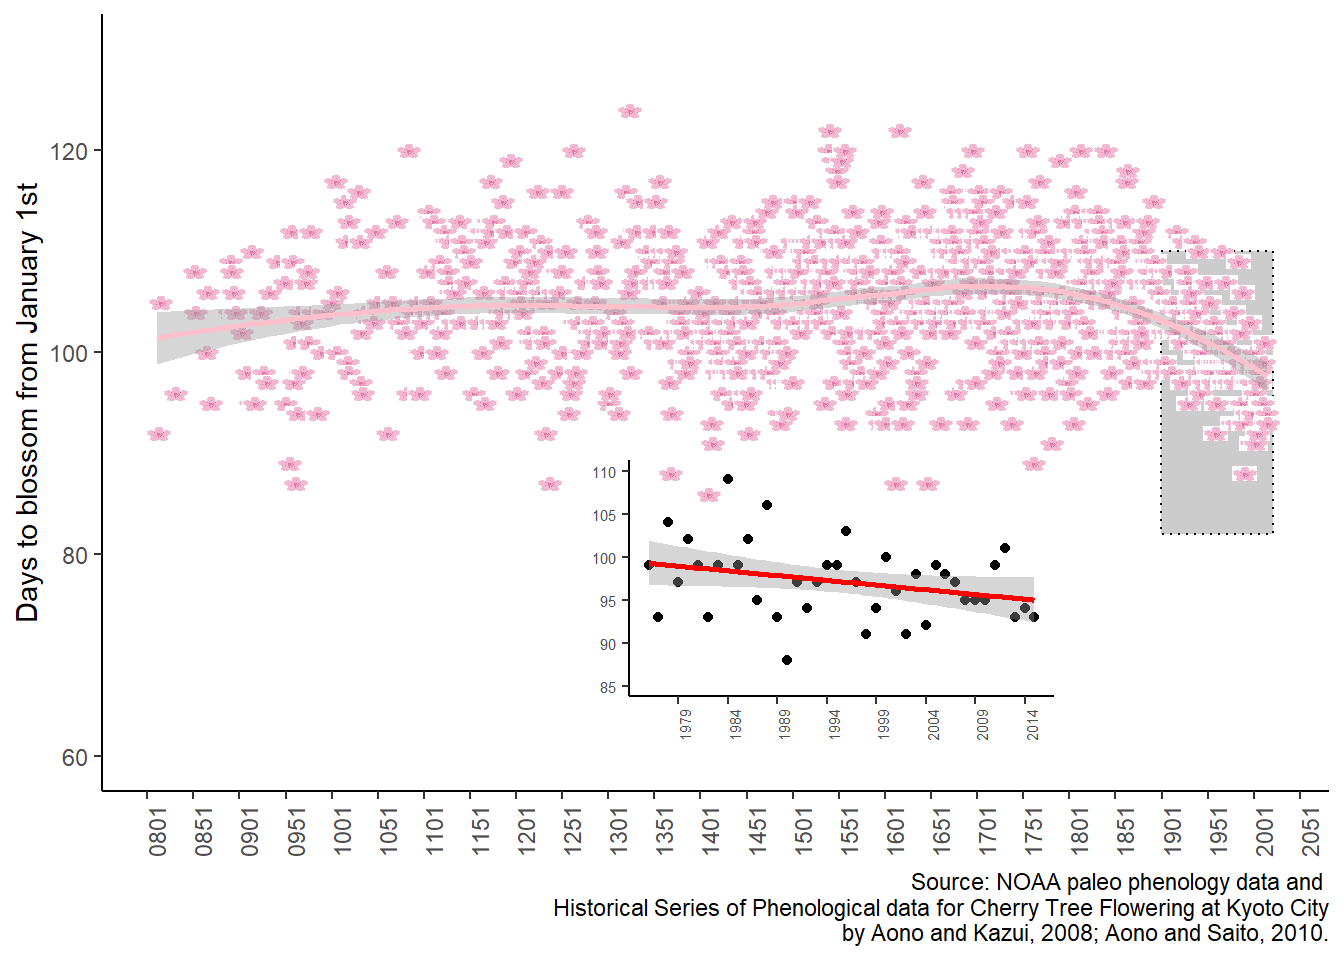
First, let’s replicate some animations showing the historical trends in cherry tree blossoming in Kyoto, Japan.
Check out my code
library(tidyverse, warn.conflicts =FALSE)library(lubridate)library(ggimage)library(ggpp)library(readxl)# First we upload the data and create a date variable ####sakura_data <- readxl::read_excel(paste0(getwd(),"/KyotoFullFlower7.xls"), skip =25) |> tidyr::drop_na() |> dplyr::rename("year"=1,"blossom"=2) |># Force the year variable into a date with make_year dplyr::mutate(year = lubridate::make_date(year))# Now we create a plot for only the XX century ####sakura_xx <-tibble(x=lubridate::as_date("1800-01-01"), y=60, plot =list(sakura_data |> dplyr::filter(year>1900) |>ggplot(aes(x=year, y=blossom))+geom_point()+geom_smooth(method="lm", color="red")+ylim(c(85,110))+scale_x_date(date_breaks ="5 years", date_labels ="%Y")+labs(y=NULL, x=NULL)+theme_classic()+theme(axis.text.x =element_text(angle=90),text =element_text(size=7))))sakura <- sakura_data |># Identify a variable for the cute cherry blossom image that we will use instead of a boring point: dplyr::mutate(sakura =paste0(getwd(),"/sakura.jpg")) |>#"/sessions/04-animate",ggplot(aes(x=year, y=blossom))+# Add plot inside of plot with geom_plotgeom_plot(data = sakura_xx, aes(x,y,label=plot))+# Annotate what part of the graph is being zoomedannotate(geom="rect", xmin=lubridate::as_date("1900-01-01"), xmax=lubridate::as_date("2022-01-01"),ymin=82,ymax=110, linetype="dotted", fill="grey80", color="black")+annotate(geom="rect", xmin=lubridate::as_date("1300-01-01"), xmax=lubridate::as_date("1800-01-01"),ymin=60,ymax=90, linetype="dotted", fill=NULL, color="black")+# Change the shape of the point to the aforementioned cherry blossomgeom_image(aes(image=sakura), size=0.02)+# Add a LOESS curvegeom_smooth(method="loess", color="pink")+ylim(c(60,130))+scale_x_date(date_breaks ="50 years", date_labels ="%Y")+labs(y="Days to blossom from January 1st", x=NULL, caption ="Source: NOAA paleo phenology data and \nHistorical Series of Phenological data for Cherry Tree Flowering at Kyoto City\n by Aono and Kazui, 2008; Aono and Saito, 2010.")+theme_classic()+theme(axis.text.x =element_text(angle=90))sakura
Next up: animating the image using gganimate.
Check out my code
library(tidyverse)library(lubridate)library(ggimage)library(gganimate)sakura_anim <- sakura_data |># Identify a variable for the cute cherry blossom that we will use instead of a boring point: dplyr::mutate(sakura =paste0(getwd(),"/sakura.jpg")) |>#"/sessions/04-animate",# Create a separate year variable for the animation dplyr::mutate(y=lubridate::year(year)) |># Feed data to ggplotggplot(aes(x=year, y=blossom))+# Change the shape of the point to the aforementioned cherry blossomgeom_image(aes(image=sakura), size=0.02)+# Add a LOESS curveylim(c(80,130))+scale_x_date(date_breaks ="50 years", date_labels ="%Y")+labs(y="Days to blossom from January 1st", x=NULL, subtitle ="Year {frame_time}")+theme_classic()+theme(axis.text.x =element_text(angle=90))+# Add animation so each point appears as we move from the past to the present, using the formula "as.integer" to make sure the dates don't include decimals gganimate::transition_time(as.integer(y))+# Add old points gganimate::shadow_mark()animate(sakura_anim)
Source Code
---title: "**April in Paris, Chestnuts in Blossom**"title-block-banner: "#8596c7"#title-block-banner-color: "#D9E3F1"subtitle: "*Break open a cherry tree and there are no flowers, but the spring breeze brings forth myriad blossoms.*<br>-- Ikkyu"date: "2023-04-07"image: blossoms_oecd.jpegcategories: [animation,blossoms,geom_plot,Japan,ggimage]description: "This long-awaited post is all about animation."---First, let's replicate some animations showing the historical trends in cherry tree blossoming in Kyoto, Japan.```{r plotting blossoms data}library(tidyverse, warn.conflicts =FALSE)library(lubridate)library(ggimage)library(ggpp)library(readxl)# First we upload the data and create a date variable ####sakura_data <- readxl::read_excel(paste0(getwd(),"/KyotoFullFlower7.xls"), skip =25) |> tidyr::drop_na() |> dplyr::rename("year"=1,"blossom"=2) |># Force the year variable into a date with make_year dplyr::mutate(year = lubridate::make_date(year))# Now we create a plot for only the XX century ####sakura_xx <-tibble(x=lubridate::as_date("1800-01-01"), y=60, plot =list(sakura_data |> dplyr::filter(year>1900) |>ggplot(aes(x=year, y=blossom))+geom_point()+geom_smooth(method="lm", color="red")+ylim(c(85,110))+scale_x_date(date_breaks ="5 years", date_labels ="%Y")+labs(y=NULL, x=NULL)+theme_classic()+theme(axis.text.x =element_text(angle=90),text =element_text(size=7))))sakura <- sakura_data |># Identify a variable for the cute cherry blossom image that we will use instead of a boring point: dplyr::mutate(sakura =paste0(getwd(),"/sakura.jpg")) |>#"/sessions/04-animate",ggplot(aes(x=year, y=blossom))+# Add plot inside of plot with geom_plotgeom_plot(data = sakura_xx, aes(x,y,label=plot))+# Annotate what part of the graph is being zoomedannotate(geom="rect", xmin=lubridate::as_date("1900-01-01"), xmax=lubridate::as_date("2022-01-01"),ymin=82,ymax=110, linetype="dotted", fill="grey80", color="black")+annotate(geom="rect", xmin=lubridate::as_date("1300-01-01"), xmax=lubridate::as_date("1800-01-01"),ymin=60,ymax=90, linetype="dotted", fill=NULL, color="black")+# Change the shape of the point to the aforementioned cherry blossomgeom_image(aes(image=sakura), size=0.02)+# Add a LOESS curvegeom_smooth(method="loess", color="pink")+ylim(c(60,130))+scale_x_date(date_breaks ="50 years", date_labels ="%Y")+labs(y="Days to blossom from January 1st", x=NULL, caption ="Source: NOAA paleo phenology data and \nHistorical Series of Phenological data for Cherry Tree Flowering at Kyoto City\n by Aono and Kazui, 2008; Aono and Saito, 2010.")+theme_classic()+theme(axis.text.x =element_text(angle=90))sakura```Next up: animating the image using gganimate.```{r blossoms animation}library(tidyverse)library(lubridate)library(ggimage)library(gganimate)sakura_anim <- sakura_data |># Identify a variable for the cute cherry blossom that we will use instead of a boring point: dplyr::mutate(sakura =paste0(getwd(),"/sakura.jpg")) |>#"/sessions/04-animate",# Create a separate year variable for the animation dplyr::mutate(y=lubridate::year(year)) |># Feed data to ggplotggplot(aes(x=year, y=blossom))+# Change the shape of the point to the aforementioned cherry blossomgeom_image(aes(image=sakura), size=0.02)+# Add a LOESS curveylim(c(80,130))+scale_x_date(date_breaks ="50 years", date_labels ="%Y")+labs(y="Days to blossom from January 1st", x=NULL, subtitle ="Year {frame_time}")+theme_classic()+theme(axis.text.x =element_text(angle=90))+# Add animation so each point appears as we move from the past to the present, using the formula "as.integer" to make sure the dates don't include decimals gganimate::transition_time(as.integer(y))+# Add old points gganimate::shadow_mark()animate(sakura_anim)```